![Mark Campbell looks at how California debt Issuers are performing: A three-part series on LinkedIn [Part 2]](https://www.affiliatedmonitors.com/wp-content/uploads/2019/06/laptop-seth-schwiet-40984-unsplash_small.jpg)
California Annual Debt Report Compliance Rates are LOWEST among Counties, Joint Powers Authorities (Marks-Roos Districts) and the State of California
In June, I posted comments on the low compliance rates among public agencies required to submit annual debt reports under California law. Senate Bill 1029 (Chapter 307, Statutes of 2016) requires public agencies that report the sale of debt to the California Debt and Investment Advisory Commission (CDIAC) after January 2017 to report to CDIAC on the debt until the principal is paid off and the proceeds fully expended.
I randomly sorted from all those agencies that had reported to CDIAC between April 4, 2017, the first submittals under the new law, and May 8, 2020, to assess compliance. My sample provided a 95 percent confidence level at a 5 percent standard deviation. I found that on 32 percent of the reports were filed on time. Forty-four (44%) percent were late or past due. Twenty (20%) percent were pending submission and another 4 percent of the debt issues had been paid off and the proceeds spend. The non-compliance rate suggests that SB 1029 is not increasing accountability and interested parties, including tax payers, must rely on other sources of information to determine how bond funds are being spent.
Between April 2017 and May 2020, 32 percent of annual debt reports to CDIAC were FILED ON-TIME
44 percent were LATE or PAST DUE
The next logical step in this analysis is to determine whether there are any notable trends in these results. In this piece, I’ll consider the type of public agency and how each complied with their annual reporting requirements.
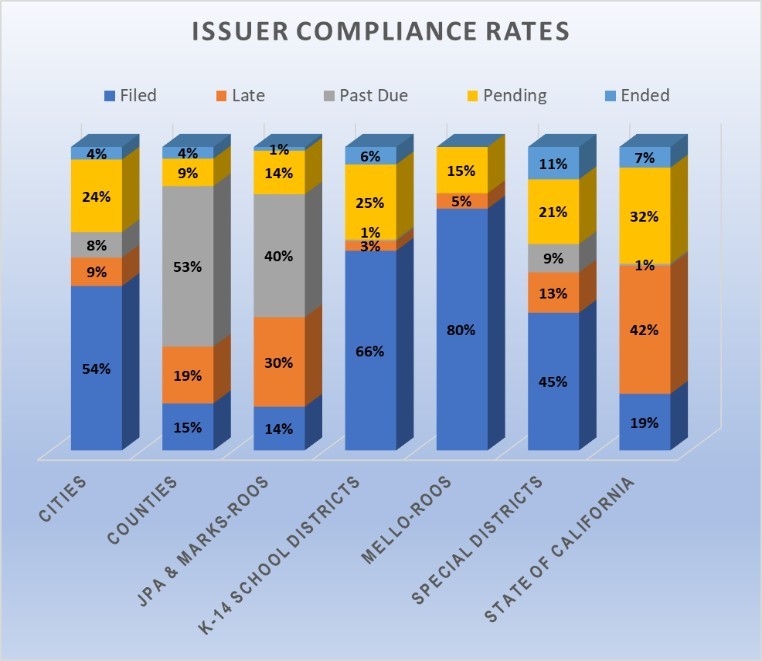
CDIAC categorizes issuers by groups and type. I have focused on groups because there are fewer of them and it makes the analysis more accessible to readers. Recall that CDIAC classifies compliance with the annual debt report obligation in one of five ways: 1) Ended because the debt has been paid off and proceeds spent; 2) Filed; 3) Late because the issuer missed the filing deadline; 4) Past Due because the issuer did not submit a report 12 months after it was due; and 5) Pending because the issuer has not submitted the report but the filing period has not closed.
The sample of 1,150 debt issuers included cities, county governments, Joint Powers Agencies along with Marks-Roos Districts, K-14 school districts, Mello-Roos districts, special districts, the State of California, and the University of California and California State University system. The breakdown of the sample by group of issuers is presented in the table below. The majority of issues in the sample were by JPSs/Marks-Roos districts. Most of these are PACE financings, each issued as a separate bond and, therefore, required to file a separate annual report. The next most common were K-14 school districts (16.5%), the State of California (14%), and county governments (13.5%).
Using the same sample population, I compared the compliance rates between issuer types. The results by grouping are not necessarily significant at the 95 percent level because I choose not to stratify the original sample. Doing so would have hampered my efforts to evaluate the overall compliance rates for ALL issues. Because of the small number of issues, I did not include UC/CSU in the chart below.

Mello-Roos districts had the highest percentage of on-time filings (80%), followed by K-14 school districts (66%) and cities (54%). The fact that most Mello-Roos districts employ 3rd party administrators to manage their reporting and compliance may explain these results. The lowest on-time filing rates were among JPAs and Marks-Roos districts (14%), counties (15%), and the State of California (19%). The low compliance rates for Marks-Roos districts syncs with the number of PACE financings they must administer and the challenge in getting these reports completed.
The LOWEST rates of ON-TIME reporting were found among JPAs/Marks-Roos districts (14%), counties (15%), and the State of California (19%)
When you combine the late, pending, and past due filings, some issuer types are more recalcitrant than others. Eighty-four (84%) percent of issues by JPAs/Marks-Roos districts have not filed their annual debt reports as required by SB 1029. Eighty-one (81%) percent of counties and 75% of State of California issues have also not filed their annual debt reports.
Aside from the administrative challenges JPAs/Marks-Roos issuers face, counties and the State of California should be asked why their compliance is so poor.
In the next article, I will dive into the results for issuers to test the significance of these findings and to determine whether there are any patterns that help to explain the poor compliance rates.